DIRECT ANSWER
For Walmart Marketplace Sponsored Products, as of September 2026, first align the reporting window and sales scope. Then separate click cost, orders per click, and sales per order; inspect item health and campaign mix before choosing a change. Falling ROAS alone does not identify the cause or tell you which bid to change.
The campaign’s return on ad spend falls from 2.00 to 1.12. A blanket bid cut feels like the fastest response, but that single ratio has not told you whether clicks became more expensive, fewer clicks produced orders, the orders became smaller, or the report is being compared on a different basis.
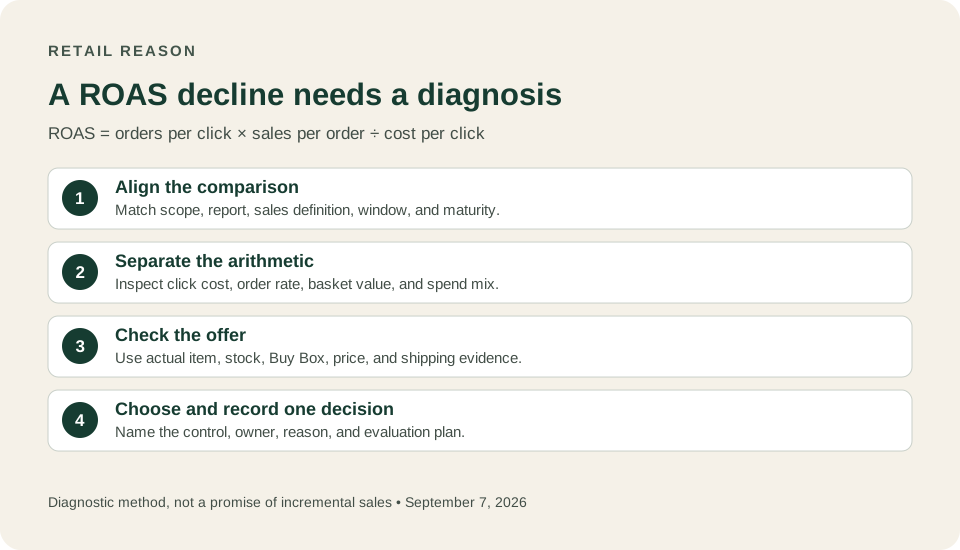
For a U.S. Walmart Marketplace seller using Sponsored Products, start with a comparable read, break the ratio into its parts, and inspect the offer before selecting the media lever. Walmart Connect’s campaign optimization guidance identifies budgets, bids, keywords, and products as distinct controls and recommends examining item health before expanding spend. The diagnostic sequence below is Retail Reason’s method for choosing among those controls.
Is the comparison measuring the same thing?
Record the campaign and item scope, date range, extraction date, and selected attribution window for both periods. Use the same report family and sales definition. The Sponsored Search metric reference defines online attributed sales and orders for 3-, 14-, and 30-day click windows and identifies separate in-store metrics. Those are different numerators, even when a spreadsheet labels all of them “sales.”
An example reported under a 14-day click window needs the relevant clicks to have had the opportunity to accumulate that window. Comparing a mature earlier period with a recent period that is still accumulating qualifying purchases can manufacture a decline. Record the extraction time and refresh both sides together. This is a comparability check, not a promise that every report becomes final at a particular hour.
Use the same currency and account, and inspect any change in reporting methodology or filters. The worksheet provides separate fields for the window, sales scope, report family, and maturity confirmation so that a chart cannot hide those choices.
Which part of ROAS changed?
For a consistent set of positive spend, clicks, attributed orders, and attributed sales, the following identity is exact:
ROAS = (attributed orders / clicks) × (attributed sales / attributed orders) ÷ (spend / clicks)
The three parts are orders per click, attributed sales per attributed order, and cost per click. This identity explains the arithmetic; it does not establish what caused a customer to buy. A zero denominator makes its ratio unavailable. With positive clicks and zero orders, orders per click is zero, but sales per order is undefined and the decomposition cannot be used. Inspect that zero directly; do not replace a missing denominator with one.
Fictional worked example. Every value below is invented. It represents one seller’s fixed campaign scope, one online sales definition, and two seven-day July periods extracted on September 7 after the selected 14-day windows had elapsed. It is not a Retail Reason customer case study, benchmark, or reported campaign result.
| Measure | Fictional earlier period | Fictional later period | Change |
|---|---|---|---|
| Spend | $1,000 | $1,250 | +25% |
| Clicks | 1,000 | 1,000 | 0% |
| Attributed orders | 50 | 40 | -20% |
| Attributed sales | $2,000 | $1,400 | -30% |
| Cost per click | $1.00 | $1.25 | +25% |
| Orders per click | 5.0% | 4.0% | -20% relative |
| Sales per attributed order | $40 | $35 | -12.5% |
| ROAS | 2.00 | 1.12 | -44% |
The decline combines all three factors: 0.80 × 0.875 ÷ 1.25 = 0.56, so the later ROAS is 56% of the earlier value. A bid-only explanation misses the lower order rate and smaller basket. Equally, a title-only explanation misses the increase in click cost.
Which system should the seller inspect next?
Use each movement to nominate an investigation, not to declare a cause. Record a competing explanation and the next evidence needed before taking action.
| Signal | Investigation | Evidence that changes the decision |
|---|---|---|
| Higher cost per click | Check keyword, placement, product, and bid history for a changed traffic mix. | Comparable segments show whether the increase is broad or concentrated in newly funded traffic. |
| Fewer orders per click | Inspect offer availability, Buy Box, delivery promise, product information, and relevance to the search terms. | An actual offer problem routes work to the seller’s operations or catalog owner. |
| Lower sales per order | Compare purchased-item mix and price or promotion changes. | A deliberate shift toward lower-priced products needs a different commercial interpretation from an unexplained decline. |
| Stable segment results but weaker total ROAS | Compare each segment’s share of spend. | More spend in a lower-return segment can lower the total without any segment deteriorating. |
The fictional seller’s review log now supplies additional facts: its higher-priced jar set was unavailable for part of the later period, the entry-price tray received more of the spend, and several newly added broad keywords carried higher click costs. These facts are invented inputs to the example, not conclusions extracted from the table.
The seller assigns three separate tasks. Operations confirms the jar set’s stock and sellable offer. The media owner isolates the new traffic for review rather than cutting every keyword. The commercial owner checks whether the smaller basket still produces an acceptable contribution after product and fulfillment costs. The team records which changes it applies and their times before planning a later evaluation.
This is where Seller Center and the product record belong beside Ad Center. Sponsored Products eligibility for Marketplace includes a published item, available stock, and a winning Buy Box. Marketplace eligibility guide. When the offer fails one of those checks, a bid increase alone cannot repair it.
Where do quality reports and item alerts help?
Marketplace advertising teams can use item health signals to find the item behind an aggregate change. Walmart’s June 4, 2026 API changelog describes Marketplace-only item alerts for disablement, price increases, Buy Box win-rate drops, and listing-quality issues, refreshed daily. The same release adds more Item Health Snapshot V2 component scores and identifies old score fields scheduled for retirement.
For a seller or agency using an integration, ask which fields and dates its dashboard actually uses. An apparently stable placeholder field is not reassurance. A daily alert is also not a substitute for a current offer inspection. If the problem concerns content, use the quality-report decision workflow to prepare an accurate correction with a named owner.
How do you choose the action and judge it later?
Write a decision sentence before making the change: “For these items and terms, we will change this one control because this evidence supports that diagnosis; we will review these measures after the chosen evaluation period.” Keep urgent offer repairs separate in the log, since leaving an unavailable item unresolved is not a useful experiment.
Set the economic target with the seller’s own costs. As a purely arithmetic example, a 40% contribution margin before advertising implies a 2.50 revenue-to-ad-spend break-even ratio, because 1 / 0.40 = 2.50. That works only if the revenue basis matches and the margin includes the relevant variable costs. It is not a universal Walmart target, and retail attributed revenue is not the same as cash received or profit. For the cash side, see the Marketplace payout reconciliation answer.
Finally, distinguish the diagnostic result from a causal result. A before-and-after ROAS recovery can coincide with stock recovery, seasonality, price changes, or different shoppers. Walmart Connect lists attribution and incrementality as separate measurement approaches. Describe what improved and which alternative explanations remain before claiming that an advertising change produced incremental sales.
Download the blank ROAS comparison worksheet, the fictional numerical example, and the decision log. The files use plain values and Retail Reason field names; they do not upload to Ad Center or change a campaign.
When that operating review leads to a larger budget decision, Startup Success Lab’s media-lift guide explains the evidence needed to judge incremental business value. Keep that question separate from reconciling attributed ROAS.
What are the limits of this answer?
The platform claims were checked September 7, 2026. This is a Marketplace Sponsored Products diagnosis, not a guide to Display, Sponsored Videos view attribution, or supplier reporting. The worksheet decomposes an observed ratio and organizes a review; it neither proves incrementality nor recommends a specific bid. The fictional example stops at an action plan and claims no subsequent improvement. Retail Reason cannot inspect the seller’s accounts or apply the proposed changes.
Sources checked
- Walmart Connect campaign optimization, checked 2026-09-07.
- Sponsored Search Snapshot Reports V2 metrics, checked 2026-09-07.
- Marketplace Sponsored Search eligibility, checked 2026-09-07.
- Item alerts and Item Health changes, June 4, 2026, checked 2026-09-07.
- Walmart Connect measurement, checked 2026-09-07.